Derotating Coordinates around a given GeoRegion
Using the rotation and centroid properties of a GeoRegion, we are able to perform derotation of coordinates about the centroid of a given GeoRegion, allowing us to project longitude/latitude coordinates and even data into a x/y-cartesian coordinate system.
Let us now setup the example
using GeoRegions
using DelimitedFiles
using CairoMakie

download("https://raw.githubusercontent.com/natgeo-wong/GeoPlottingData/main/coastline_resl.txt","coast.cst")
coast = readdlm("coast.cst",comments=true)
clon  = coast[:,1]
clat  = coast[:,2]
nothing
Let us create a custom GeoRegion around the Sumatra island, with a defined rotation of -45º:
geo = GeoRegion([104.5, 92.5, 97, 109, 104.5],[-8.5, 3.5, 8, -4, -8.5],rotation=-45)The GeoRegion has the following properties:
Region ID (ID) :
Parent ID (pID) :
Name (name) :
Bounds (N,S,E,W) : 8.0, -8.5, 109.0, 92.5
Rotation (θ) : -45.0
File Path (path) : /home/runner/.georegions/.json
Centroid (geometry.centroid) : [100.75, -0.25]
Shape (geometry.shape) : Vector{Point{2, Float64}}(5)For more information about creating custom GeoRegions, see here and here.
Derotating the GeoRegion itself
First, let us retrieve the normal coordinates of the GeoRegion and plot them
lon,lat = coordinates(geo)
lonc,latc = geo.geometry.centroid
fig = Figure()
ax = Axis(
    fig[1,1],width=375,height=375,
    limits=(89,113,-12,12)
)
lines!(ax,clon,clat,color=:black,linewidth=3)
lines!(ax,lon,lat,linewidth=5)
scatter!(ax,lonc,latc,markersize=20)
resize_to_layout!(fig)
fig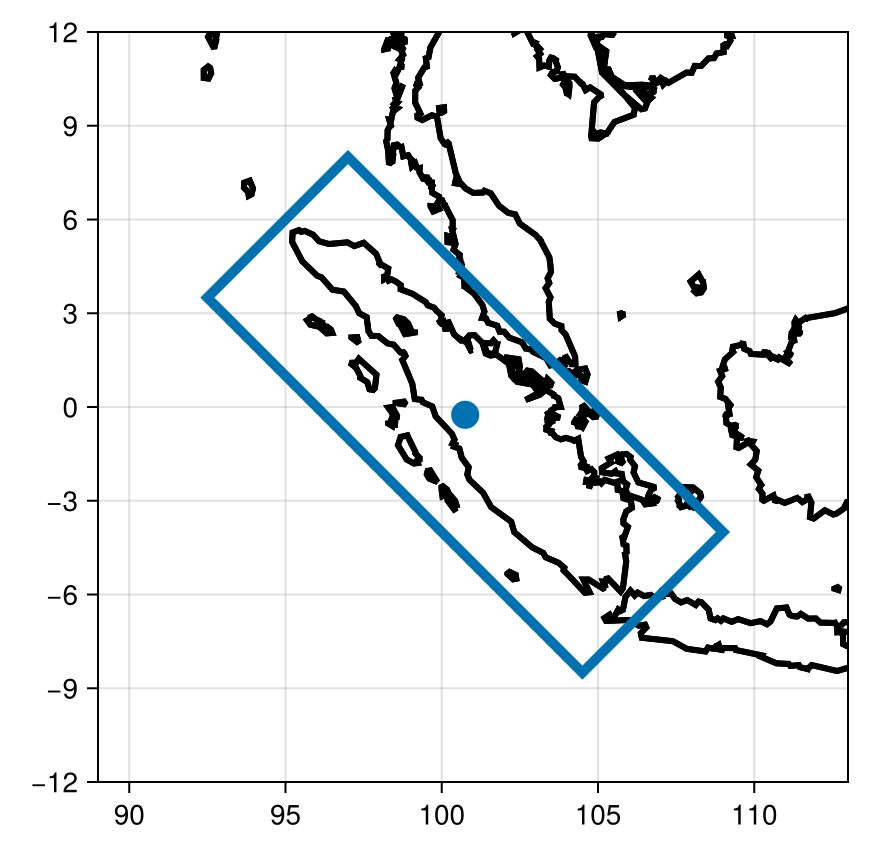
We can pass the arguments derotate and rotation to the coordinates() function in order to obtain the derotated shape coordinates, as follows:
rlon1,rlat1 = coordinates(geo,derotate=true) ./ 1e3
rlon2,rlat2 = coordinates(geo,derotate=true,rotation=0) ./ 1e3
rlon3,rlat3 = coordinates(geo,derotate=true,rotation=-30) ./ 1e3
rlon4,rlat4 = coordinates(geo,derotate=true,rotation=geo.θ) ./ 1e3
nothing
Derotation of Longitude/Latitude Coordinates
Similarly, we can also derotate a given set of coordinates around the centroid of the GeoRegion, based on our estimate in geo.θ as to how much the GeoRegion was originally rotated.
rclon1,rclat1 = derotatecoordinates(clon,clat,geo) ./ 1e3
rclon2,rclat2 = derotatecoordinates(clon,clat,geo,rotation=0) ./ 1e3
rclon3,rclat3 = derotatecoordinates(clon,clat,geo,rotation=-30) ./ 1e3
rclon4,rclat4 = derotatecoordinates(clon,clat,geo,rotation=geo.θ) ./ 1e3
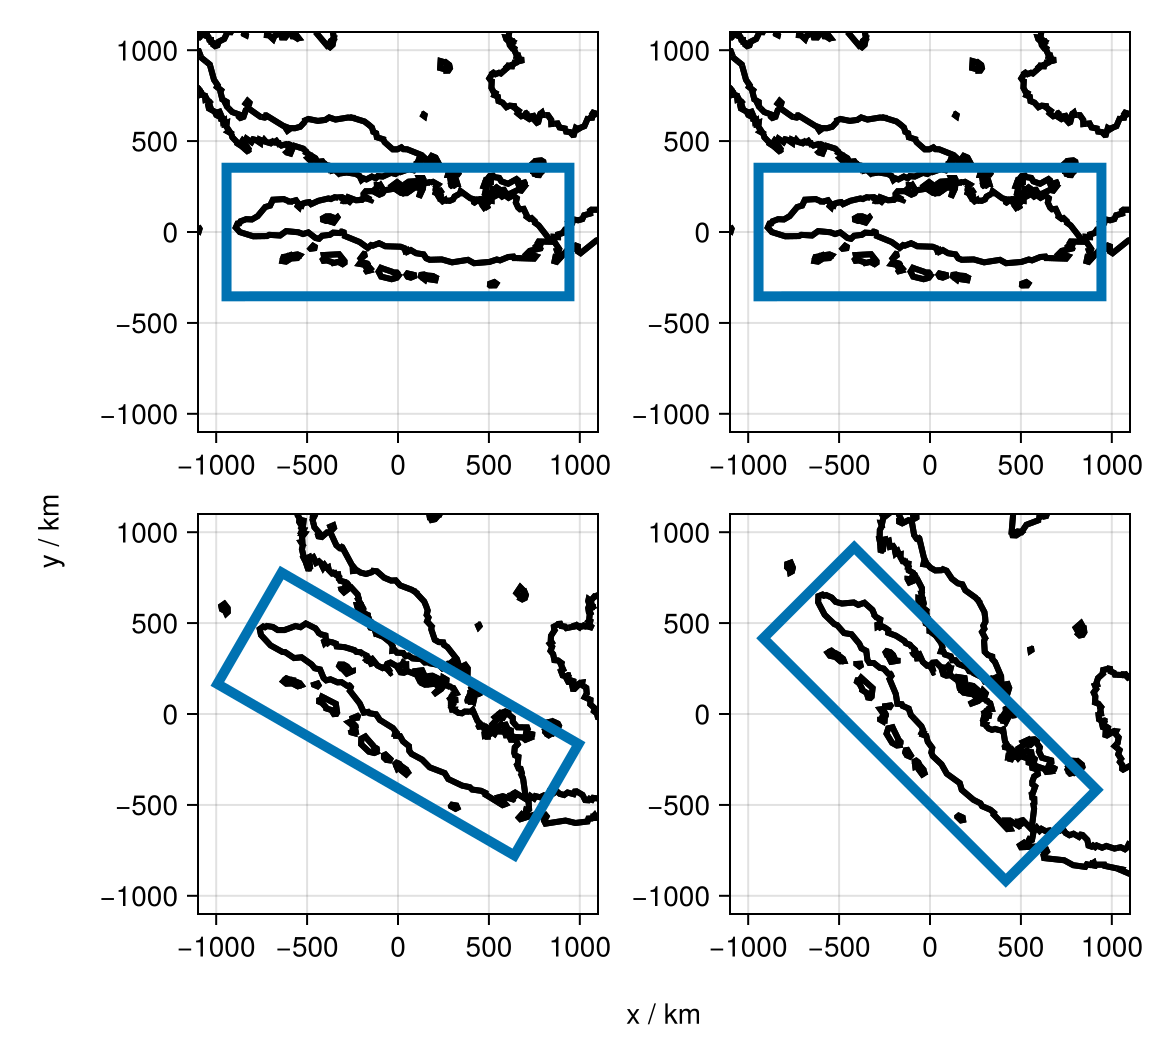
nothingVisualization of the Derotation
Now, let's visualize these derotated coordinates and shapes
fig = Figure()

ax1 = Axis(
    fig[1,1],width=200,height=200,
    limits=(-1,1,-1,1).*1.1e3,
)
lines!(ax1,rclon1,rclat1,color=:black,linewidth=3)
lines!(ax1,rlon1,rlat1,linewidth=5)

ax2 = Axis(
    fig[1,2],width=200,height=200,
    limits=(-1,1,-1,1).*1.1e3
)
lines!(ax2,rclon2,rclat2,color=:black,linewidth=3)
lines!(ax2,rlon2,rlat2,linewidth=5)

ax3 = Axis(
    fig[2,1],width=200,height=200,
    limits=(-1,1,-1,1).*1.1e3
)
lines!(ax3,rclon3,rclat3,color=:black,linewidth=3)
lines!(ax3,rlon3,rlat3,linewidth=5)

ax4 = Axis(
    fig[2,2],width=200,height=200,
    limits=(-1,1,-1,1).*1.1e3
)
lines!(ax4,rclon4,rclat4,color=:black,linewidth=3)
lines!(ax4,rlon4,rlat4,linewidth=5)

Label(fig[3,:],"x / km")
Label(fig[:,0],"y / km",rotation=pi/2)

resize_to_layout!(fig)
fig