Is it in a GeoRegion?
When dealing with geographic data, we often wish to check if a point or region is inside another region. GeoRegions.jl allows you to perform this check easily with the function isinGeoRegion.
Point2 Type
We use the Point2 Type from the package GeometryBasics.jl, which is reexported by GeoRegions.jl, as an easy way to denote points. This also allows us to use the package GeometryOps.jl to determine if a point is within a GeoRegion.
using GeoRegions
using DelimitedFiles
using CairoMakie

download("https://raw.githubusercontent.com/natgeo-wong/GeoPlottingData/main/coastline_resl.txt","coast.cst")
coast = readdlm("coast.cst",comments=true)
clon  = coast[:,1]
clat  = coast[:,2]
nothing
Is a Point in a GeoRegion?
As an example, let us test if a point is in GeoRegion AR6_EAO, defined in the blue bounding box below. We define the below points:
Point A at coordinates (-20,5)
Point B at coordinates (340,5)
Point C at coordinates (30,15)
A = Point(-20,5)
B = Point(340,5)
C = Point(-45,-7.5)
geo = GeoRegion("AR6_EAO")
The GeoRegion AR6_EAO has the following properties:
Region ID (ID) : AR6_EAO
Parent ID (pID) : GLB
Name (name) : Equatorial Atlantic Ocean
Bounds (N,S,E,W) : 7.6, -10.0, 8.0, -50.0
Rotation (θ) : 0.0
File Path (path) : /home/runner/work/GeoRegions.jl/GeoRegions.jl/src/.files/AR6/AR6_EAO.json
Centroid (geometry.centroid) : [-19.31990102509721, -1.27790738776953]
Shape (geometry.shape) : Vector{Point{2, Float64}}(8)Here, we note that the coordinates of the GeoRegion (Equatorial Atlantic Ocean) are given in the bounds of (-180,180). It is trivial in this case to calculate if points A and C are within the bounds of the GeoRegion.
slon,slat = coordinates(geo)
aspect = (maximum(slon)-minimum(slon))/(maximum(slat)-minimum(slat))
fig = Figure()
ax = Axis(
    fig[1,1],width=750,height=750/aspect,
    limits=(minimum(slon)-2,maximum(slon)+2,minimum(slat)-2,maximum(slat)+2),
    xlabel = "Longitude / º", ylabel = "Latitude / º"
)
lines!(ax,clon,clat,color=:black,linewidth=3)
lines!(ax,slon,slat,linewidth=5)
scatter!(ax,A,markersize=20)
scatter!(ax,C,markersize=20)
resize_to_layout!(fig)
fig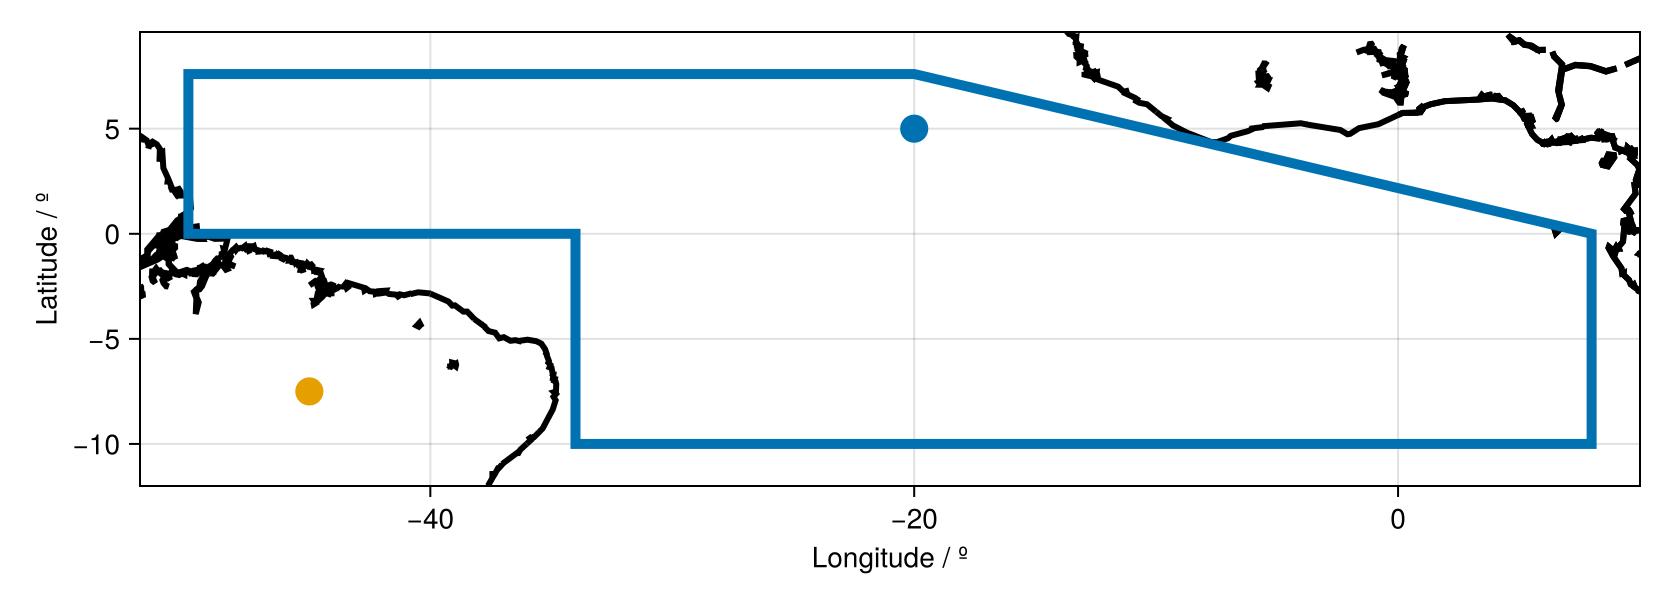
By eye it is easy to see that Point A is inside the GeoRegion. However, C is not. Let us now see if we are able to corroborate this with GeoRegions.jl using the function in()
in(A,geo), # Point A
in(C,geo)  # Point C
(true, false)But what about Point B? Point B is also very obvious within the bounds of the GeoRegion, it is simply that the longitude of Point A is shifted by 360º such that it is now in the (0,360) coordinates frame. We see that this is of no concern to GeoRegions.jl, which can detect that it is within the bounds of the GeoRegion anyway.
in(B,geo)trueSee the API here
Is a GeoRegion inside a GeoRegion?
Since any arbitrary geographic region can be defined as a GeoRegion, the natural extension now is to determine if a GeoRegion is wholly within another GeoRegion.
Let us consider an arbitrary GeoRegion BIG, and other smaller GeoRegions TS1-4 as defined below:
geo_BIG = GeoRegion(
    [-120,-100,-100,-80,-30,15,45,75,90,115,120,105,85,45,20,-5,-45,-80,-120],
    [0,10,30,50,40,50,55,44,32,30,12,8,5,0,-10,-30,-40,-43,0],
    ID = "BIG", pID = "GLB", name = "A Big Region",
)
geo_TS1 = GeoRegion(
    [20, 20, -70, -70, 20], [45, 20, 20, 45, 45],
    ID = "TS1", pID = "GLB", name = "Test Region 1"
)
geo_TS2 = GeoRegion(
    [60,90,110,90,60], [20,25,20,15,20],
    ID = "TS2", pID = "GLB", name = "Test Region 2"
)
geo_TS3 = GeoRegion(
    [-110,-98,-95,-90,-80,-100,-110,-110], [0,10,20,15,5,0,-20,0],
    ID = "TS3", pID = "GLB", name = "Test Region 3",
)
geo_TS4 = GeoRegion(
    [300,325,330,355,330,325,320,300], [-10,-5,0,-10,-30,-35,-20,-10],
    ID = "TS4", pID = "GLB", name = "Test Region 4",
)
nothing
Next, we proceed to extract the coordinates (see here for the API):
slon_b,slat_b = coordinates(geo_BIG)
slon_1,slat_1 = coordinates(geo_TS1)
slon_2,slat_2 = coordinates(geo_TS2)
slon_3,slat_3 = coordinates(geo_TS3)
slon_4,slat_4 = coordinates(geo_TS4)
([300.0, 325.0, 330.0, 355.0, 330.0, 325.0, 320.0, 300.0], [-10.0, -5.0, 0.0, -10.0, -30.0, -35.0, -20.0, -10.0])And now let's plot the regions from the coordinates we have above.
fig = Figure()

ax = Axis(
    fig[1,1],width=750,height=750/2,
    limits=(-180,180,-90,90),
    xlabel = "Longitude / º", ylabel = "Latitude / º"
)

lines!(ax,clon,clat,color=:black,linewidth=3)
lines!(ax,slon_b,slat_b,linewidth=5,color=:blue)
lines!(ax,slon_1,slat_1,linewidth=5,color=:red)
lines!(ax,slon_2,slat_2,linewidth=5,color=:green)
lines!(ax,slon_3,slat_3,linewidth=5,color=:red)
lines!(ax,slon_4.-360,slat_4,linewidth=5,color=:green)

resize_to_layout!(fig)
fig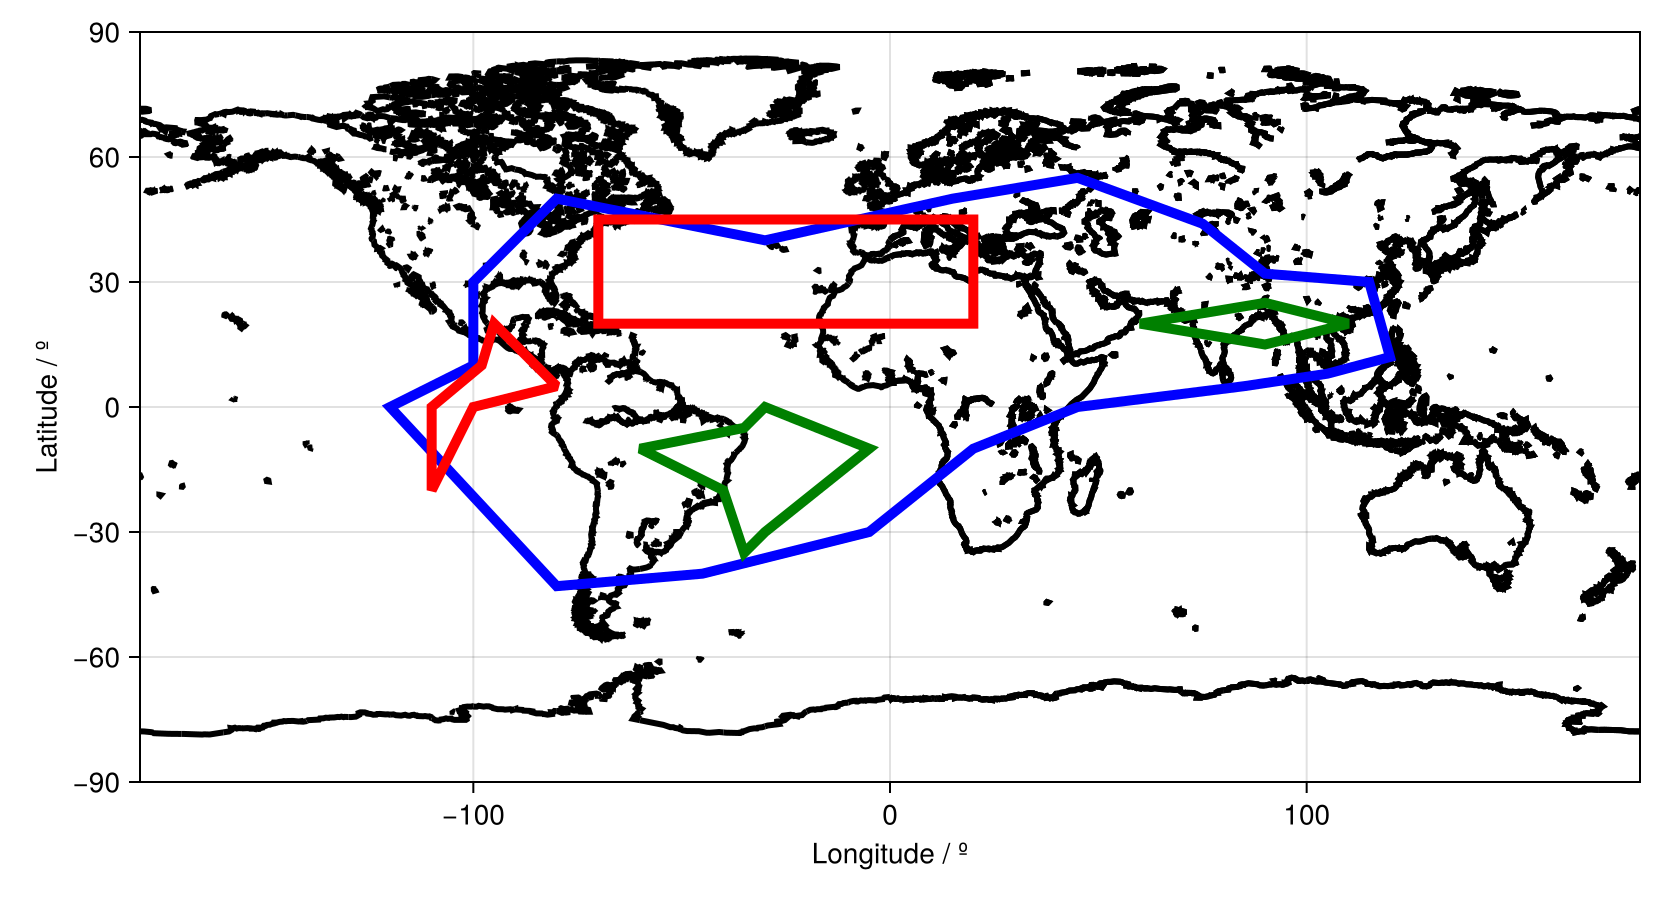
We see by eye that GeoRegion TS2 and TS4 are in the BIG region, but the other GeoRegions are not. Now let us verify this with in()
in(geo_TS1,geo_BIG),
in(geo_TS2,geo_BIG),
in(geo_TS3,geo_BIG),
in(geo_TS4,geo_BIG)
(false, true, false, true)And we see that this is indeed the case.
See the API here.