Unstructured Grids for Data Extraction
There are also RegionGrid types without an actual grid, maybe there are a set of coordinates and geometries that define the corners or the centres of a mesh, such as:
- Model output from climate models such as cubed-sphere mesh output of the Community Earth Systems Model 2 (CESM2).
Basically, for each of these datasets, the data is given in such a way that the coordinates of the grid can be expressed via:
- A Vector of
Point2types, with eachPoint2type containing (lon,lat)
using GeoRegions
using RegionGrids
using CairoMakie
Creating Unstructured Grids
A Unstructured Grid can be created as follows:
ggrd = RegionGrid(geo,Point2.(lon,lat))where geo is a GeoRegion of interest that is found within the domain defined by the longitude and latitude grid vectors.
lon = collect(10:20:360); nlon = length(lon)
lat = collect(-80:20:90); nlat = length(lat)

glon = zeros(nlon,nlat); glon .= lon;  glon = glon[:]
glat = zeros(nlon,nlat); glat .= lat'; glat = glat[:]

plon = glon .+ 14rand(nlon*nlat) .- 7
plat = glat .+ 14rand(nlon*nlat) .- 7

geo = GeoRegion([10,100,-80,10],[50,10,-40,50])

iggrd = RegionGrid(geo,Point2.(glon,glat))
pggrd = RegionGrid(geo,Point2.(plon,plat))
The VectorMask Grid type has the following properties:
Indices (ipoint) : [70, 71, 72, 73, 74, 75, 89, 90, 91, 92, 93, 94, 109]
Longitude Points (lon) : [-49.24521505042935, -28.549439911646004, -16.917314618100875, 12.956346355056795, 30.482673760351574, 44.67305963301634, -34.059094464139775, -7.077198231038267, 11.984955285046908, 25.76454305239742, 54.283307681892836, 64.05211238598875, 13.375800049813197]
Latitude Points (lat) : [-14.594482873531167, -14.045222179879831, -13.397075933773955, 5.652461143235637, -4.989587198483116, -0.8777506464168496, -1.2735536384402195, 0.94412429253111, 24.11975013682689, 19.967599970476634, 19.900518435616803, 23.610489972877104, 46.5985935324197]
Rotated X Coordinates (X)
Rotated Y Coordinates (Y)
Rotation (°) (θ) : 0.0
RegionGrid Weights (weights)
RegionGrid Size : (13,) pointsThe API for creating a Unstructured Grid can be found here
What is in a Unstructured Grid?
RegionGrids.UnstructuredGrid Type
UnstructuredGrid <: RegionGridA UnstructuredGrid is a RegionGrid that is created based on an unstructured grid often used in cubed-sphere or unstructured-mesh grids.
All UnstructuredGrid type will contain the following fields:
lon- A Vector ofFloats, defining the longitudes for each point in the RegionGrid that describe the region.lat- A Vector ofFloats, defining the latitude for each point in the RegionGrid that describe the region.ipoint- A Vector ofInts, defining the indices of the valid points from the original unstructured grid that were extracted into the RegionGrid.weights- A Vector ofFloats, defining the latitude-weights of each valid point in the grid. Will be NaN if outside the bounds of the GeoRegion used to define this RectilinearGrid.X- A Vector ofFloats, defining the X-coordinates (in meters) of each point in the "derotated" RegionGrid about the centroid for the shape of the GeoRegion.Y- A Vector ofFloats, defining the Y-coordinates (in meters) of each point in the "derotated" RegionGrid about the centroid for the shape of the GeoRegion.θ- AFloatstoring the information on the angle (in degrees) about which the data was rotated in the anti-clockwise direction. Mathematically, it isrotation - geo.θ.
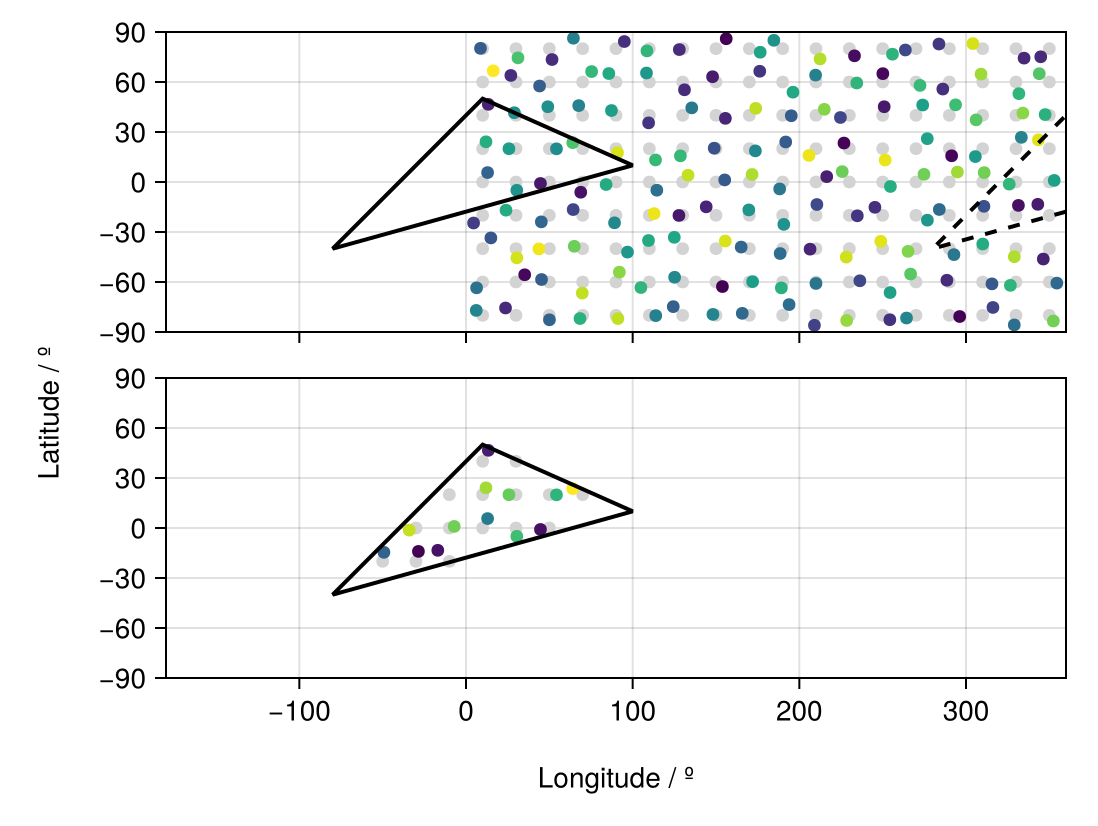
We see that in a UnstructuredGrid type, we have the lon and lat vectors that defined the perturbed longitude and latitude points that are within the GeoRegion.
pggrd.lon13-element Vector{Float64}:
-49.24521505042935
-28.549439911646004
-16.917314618100875
12.956346355056795
30.482673760351574
44.67305963301634
-34.059094464139775
-7.077198231038267
11.984955285046908
25.76454305239742
54.283307681892836
64.05211238598875
13.375800049813197pggrd.lat13-element Vector{Float64}:
-14.594482873531167
-14.045222179879831
-13.397075933773955
5.652461143235637
-4.989587198483116
-0.8777506464168496
-1.2735536384402195
0.94412429253111
24.11975013682689
19.967599970476634
19.900518435616803
23.610489972877104
46.5985935324197An example of using Unstructured Grids
Say we have some sample data, here randomly generated.
data = rand(nlon,nlat)[:]162-element Vector{Float64}:
0.4516789463016768
0.12063041391711671
0.3231923142004297
0.6341550257500155
0.9003275474372681
0.43036655354284714
0.30338121001458984
0.45010498828286416
0.3336610817763028
0.35855302101801745
⋮
0.5053295828486689
0.8801096838624729
0.03662861154670405
0.6423039623155026
0.22036574934800668
0.15894444357291304
0.9277731568674286
0.11419409741986819
0.12347200246433587We extract the valid data within the GeoRegion of interest that we defined above:
ndata = extract(data,iggrd)
pdata = extract(data,pggrd)
13-element Vector{Float64}:
0.2514402524383582
0.04478966320527411
0.07583488408361738
0.31816217025295535
0.5055108675677741
0.06899284912961912
0.653333809542824
0.5671813230790957
0.619751601252781
0.5558178922636721
0.47843516366701055
0.7101950939137968
0.0976456799678811And now let us visualize the results.
slon,slat = coordinates(geo) # extract the coordinates
fig = Figure()

ax1 = Axis(
    fig[1,1],width=450,height=150,
    limits=(-180,360,-90,90)
)
scatter!(ax1,glon,glat,color=:lightgrey)
scatter!(ax1,plon,plat,color=data)
lines!(ax1,slon,slat,color=:black,linewidth=2)
lines!(ax1,slon.+360,slat,color=:black,linewidth=2,linestyle=:dash)

hidexdecorations!(ax1,ticks=false,grid=false)

ax2 = Axis(
    fig[2,1],width=450,height=150,
    limits=(-180,360,-90,90)
)
scatter!(ax2,iggrd.lon,iggrd.lat,color=:lightgrey)
scatter!(ax2,pggrd.lon,pggrd.lat,color=pdata)
lines!(ax2,slon,slat,color=:black,linewidth=2)

Label(fig[3,:],"Longitude / º")
Label(fig[:,0],"Latitude / º",rotation=pi/2)

resize_to_layout!(fig)
fig