How do you use RegionGrids.jl?
The Basic Outline
In practice, we would use GeoRegions and RegionGrids as follows:
using GeoRegions
using RegionGrids

# 1. Get gridded data, and longitude/latitude

data = ...
dlon = ... # longitudes for gridded data points
dlat = ... # latitudes for gridded data points

# 2. Define a Geographic Region using a shape defined by vectors for longitude and latitude respectively

geo = GeoRegion(lon,lat)

# 3. Create a RegionGrid for data extraction using the GeoRegion, and longitude and latitude vectors

ggrd = RegionGrid(geo,dlon,dlat)

# 4. Extract the data within the GeoRegion of interest

longitude and latitude vectors respectively
ndata  = extract(data,ggrd)
newlon = ggrd.lon
newlat = ggrd.lat
An Example
Setup
julia
using GeoRegions
using RegionGrids
using DelimitedFiles
using CairoMakie

download("https://raw.githubusercontent.com/natgeo-wong/GeoPlottingData/main/coastline_resl.txt","coast.cst")
coast = readdlm("coast.cst",comments=true)
clon  = coast[:,1]
clat  = coast[:,2]
nothing
Defining some data
julia
lon = collect(0:5:360);  nlon = length(lon)
lat = collect(-90:5:90); nlat = length(lat)
data = rand(nlon,nlat)
73×37 Matrix{Float64}:
0.0812238 0.224903 0.105351 … 0.881194 0.263674 0.229341
0.421117 0.656025 0.93427 0.950602 0.103642 0.761393
0.415576 0.212711 0.651949 0.672037 0.177821 0.194656
0.800718 0.22442 0.775319 0.487381 0.631876 0.961199
0.651157 0.58844 0.870631 0.308444 0.11726 0.870933
0.48387 0.503397 0.204778 … 0.22449 0.923306 0.350145
0.762623 0.218623 0.849692 0.241429 0.488157 0.0276905
0.533766 0.202837 0.0422107 0.860142 0.718304 0.159859
0.300243 0.379219 0.945104 0.613197 0.93874 0.214638
0.618015 0.8179 0.753289 0.26524 0.245238 0.462673
⋮ ⋱ ⋮
0.0217823 0.311022 0.66076 0.718531 0.400483 0.350566
0.539317 0.0562367 0.742442 … 0.259962 0.754488 0.872481
0.167852 0.186317 0.449424 0.281644 0.384796 0.430098
0.387632 0.555995 0.743885 0.581411 0.0105307 0.609938
0.529698 0.495824 0.312241 0.939516 0.181722 0.0624289
0.773448 0.652111 0.0178738 0.388602 0.893496 0.0530876
0.757942 0.357402 0.196107 … 0.187664 0.0931952 0.772737
0.0235727 0.599177 0.375039 0.0978853 0.183781 0.559736
0.846909 0.461853 0.551826 0.609384 0.390897 0.589566Defining a Region of Interest
Next, we proceed to define a GeoRegion and extract its coordinates:
julia
geo = GeoRegion([10,230,-50,10],[50,10,-40,50])
slon,slat = coordinates(geo) # extract the coordinates
([10.0, 230.0, -50.0, 10.0], [50.0, 10.0, -40.0, 50.0])Let us create a RegionGrid for Data Extraction
Following which, we can define a RegionGrid:
julia
ggrd = RegionGrid(geo,lon,lat)The RLinearMask Grid type has the following properties:
Longitude Indices (ilon) : [63, 64, 65, 66, 67, 68, 69, 70, 71, 72 … 38, 39, 40, 41, 42, 43, 44, 45, 46, 47]
Latitude Indices (ilat) : [11, 12, 13, 14, 15, 16, 17, 18, 19, 20, 21, 22, 23, 24, 25, 26, 27, 28, 29]
Longitude Points (lon) : [-50, -45, -40, -35, -30, -25, -20, -15, -10, -5 … 185, 190, 195, 200, 205, 210, 215, 220, 225, 230]
Latitude Points (lat) : [-40, -35, -30, -25, -20, -15, -10, -5, 0, 5, 10, 15, 20, 25, 30, 35, 40, 45, 50]
Rotated X Coordinates (X)
Rotated Y Coordinates (Y)
Rotation (°) (θ) : 0.0
RegionGrid Mask (mask)
RegionGrid Weights (weights)
RegionGrid Size : 58 lon points x 19 lat points
RegionGrid Validity : 465 / 1102And then use this RegionGrid to extract data for the GeoRegion of interest:
julia
ndata = extract(data,ggrd)58×19 Matrix{Float64}:
0.912837 NaN NaN … NaN NaN NaN NaN NaN NaN
NaN 0.37577 NaN NaN NaN NaN NaN NaN NaN
NaN 0.267463 0.879661 NaN NaN NaN NaN NaN NaN
NaN 0.453728 0.0796741 NaN NaN NaN NaN NaN NaN
NaN 0.828482 0.768119 NaN NaN NaN NaN NaN NaN
NaN 0.269833 0.128579 … NaN NaN NaN NaN NaN NaN
NaN NaN 0.280677 NaN NaN NaN NaN NaN NaN
NaN NaN 0.138602 NaN NaN NaN NaN NaN NaN
NaN NaN 0.827751 NaN NaN NaN NaN NaN NaN
NaN NaN 0.779771 0.707908 NaN NaN NaN NaN NaN
⋮ ⋱ ⋮
NaN NaN NaN NaN NaN NaN NaN NaN NaN
NaN NaN NaN … NaN NaN NaN NaN NaN NaN
NaN NaN NaN NaN NaN NaN NaN NaN NaN
NaN NaN NaN NaN NaN NaN NaN NaN NaN
NaN NaN NaN NaN NaN NaN NaN NaN NaN
NaN NaN NaN NaN NaN NaN NaN NaN NaN
NaN NaN NaN … NaN NaN NaN NaN NaN NaN
NaN NaN NaN NaN NaN NaN NaN NaN NaN
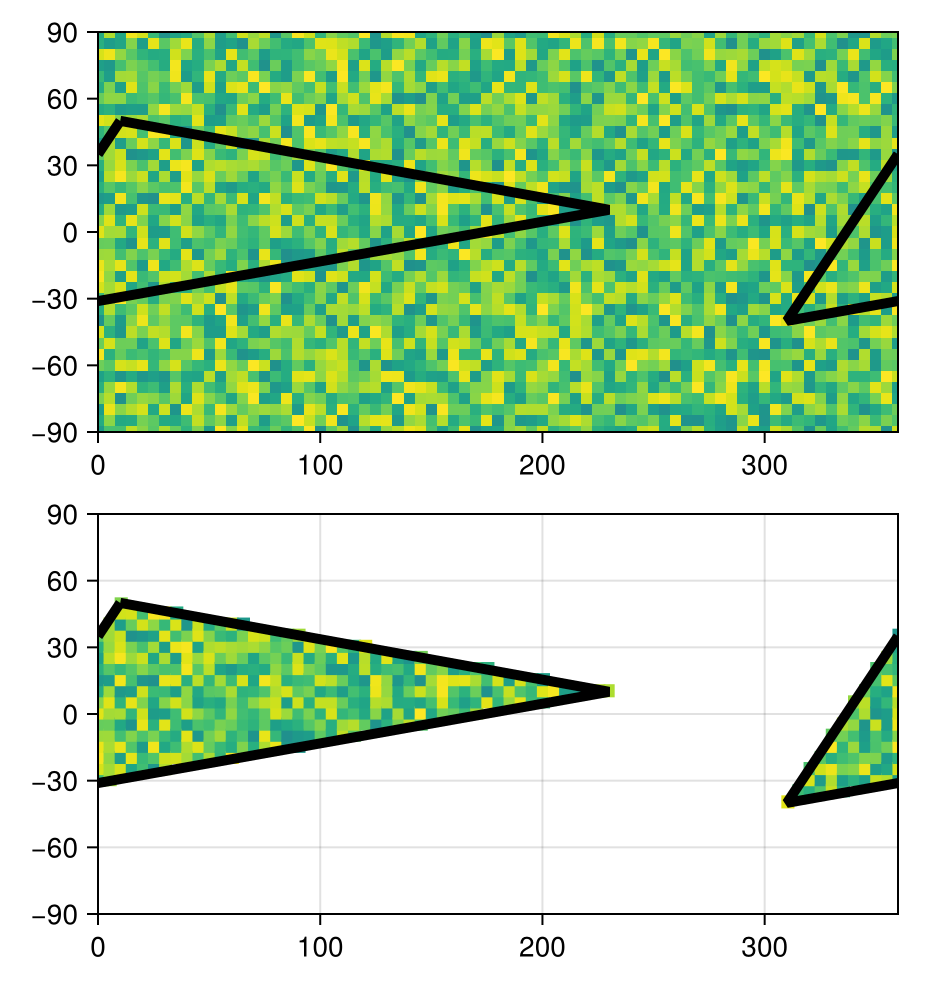
NaN NaN NaN NaN NaN NaN NaN NaN NaNData Visualization
julia
fig = Figure()

ax1 = Axis(
    fig[1,1],width=400,height=200,
    limits=(0,360,-90,90)
)
heatmap!(ax1,lon,lat,data,colorrange=(-1,1))
lines!(ax1,slon,slat,color=:black,linewidth=5)
lines!(ax1,slon.+360,slat,color=:black,linewidth=5)

ax2 = Axis(
    fig[2,1],width=400,height=200,
    limits=(0,360,-90,90)
)
heatmap!(ax2,ggrd.lon,ggrd.lat,ndata,colorrange=(-1,1))
heatmap!(ax2,ggrd.lon.+360,ggrd.lat,ndata,colorrange=(-1,1))
lines!(ax2,slon,slat,color=:black,linewidth=5)
lines!(ax2,slon.+360,slat,color=:black,linewidth=5)

resize_to_layout!(fig)
fig