Generalized Grids for Data Extraction
Not all longitude-latitude grids are rectilinear in the lon/lat space. RegionGrid classifies this type as a GeneralizedGrid. Examples of such datasets include:
Level 2 products from the Global Precipitation Measurement Mission
Model output from climate models such as Weather Research & Forecasting Model (WRF)
Basically, for each of these datasets, the data is given in such a way that the coordinates of the grid can be expressed via:
- A 2D array of
Point2types, with eachPoint2type containing (lon,lat)
using GeoRegions
using RegionGrids
using CairoMakie
Creating Generalized Grids
A Generalized Grid can be created as follows:
ggrd = RegionGrid(geo,Point2.(lon,lat))where geo is a GeoRegion of interest that is found within the domain defined by the longitude and latitude grid vectors.
nlon = 51; nlat = 31
lon = zeros(nlon,nlat)
lat = zeros(nlon,nlat)
for ilat = 1 : nlat, ilon = 1 : nlon
    lon[ilon,ilat] = (ilon-26) * (5 + (ilat-16) * 0.1)
    lat[ilon,ilat] = (ilat-16) * 5
end
geo = GeoRegion([10,100,-80,10],[50,10,-40,50])

ggrd = RegionGrid(geo,Point2.(lon,lat))
The GeneralMask type has the following properties:
Longitude Indices (ilon)
Latitude Indices (ilat)
Longitude Points (lon)
Latitude Points (lat)
Rotated X Coordinates (X)
Rotated Y Coordinates (Y)
Rotation (°) (θ) : 0.0
RegionGrid Mask (mask)
RegionGrid Weights (weights)
RegionGrid Size : 37 lon points x 17 lat points
RegionGrid Validity : 230 / 629The API for creating a Generalized Grid can be found here
What is in a Generalized Grid?
RegionGrids.GeneralizedGrid Type
GeneralizedGrid <: RegionGridA GeneralizedGrid is a RegionGrid that is created based on longitude/latitude grids that are not rectilinear - this can range from curvilinear grids to unstructured grids. It has its own subtypes: RegionMask and VectorMask.
All GeneralizedGrid type will contain the following fields:
lon- A Matrix ofFloats, defining the longitudes for each point in the RegionGrid that describe the region.lat- A Matrix ofFloats, defining the latitude for each point in the RegionGrid that describe the region.ilon- A Matrix ofInts, defining the indices used to extract the longitude vector from the input longitude vector.ilat- A Matrix ofInts, defining the indices used to extract the latitude vector from the input latitude vector.mask- An Matrix of NaNs and 1s, defining the gridpoints in the RegionGrid where the data is valid.weights- A Matrix ofFloats, defining the latitude-weights of each valid point in the grid. Will be NaN if outside the bounds of the GeoRegion used to define this RectilinearGrid.X- A Matrix ofFloats, defining the X-coordinates (in meters) of each point in the "derotated" RegionGrid about the centroid for the shape of the GeoRegion.Y- A Matrix ofFloats, defining the Y-coordinates (in meters) of each point in the "derotated" RegionGrid about the centroid for the shape of the GeoRegion.θ- AFloatstoring the information on the angle (in degrees) about which the data was rotated in the anti-clockwise direction. Mathematically, it isrotation - geo.θ.
We see that in a GeneralizedGrid type, we have the lon and lat arrays that defined the longitude and latitude points that have been cropped to fit the GeoRegion bounds.
ggrd.lon37×17 Matrix{Float64}:
-73.1 -74.8 -76.5 -78.2 -79.9 … 266.5 264.8 263.1 261.4 259.7
-68.8 -70.4 -72.0 -73.6 -75.2 272.0 270.4 268.8 267.2 265.6
-64.5 -66.0 -67.5 -69.0 -70.5 277.5 276.0 274.5 273.0 271.5
-60.2 -61.6 -63.0 -64.4 -65.8 -77.0 -78.4 -79.8 278.8 277.4
-55.9 -57.2 -58.5 -59.8 -61.1 -71.5 -72.8 -74.1 -75.4 -76.7
-51.6 -52.8 -54.0 -55.2 -56.4 … -66.0 -67.2 -68.4 -69.6 -70.8
-47.3 -48.4 -49.5 -50.6 -51.7 -60.5 -61.6 -62.7 -63.8 -64.9
-43.0 -44.0 -45.0 -46.0 -47.0 -55.0 -56.0 -57.0 -58.0 -59.0
-38.7 -39.6 -40.5 -41.4 -42.3 -49.5 -50.4 -51.3 -52.2 -53.1
-34.4 -35.2 -36.0 -36.8 -37.6 -44.0 -44.8 -45.6 -46.4 -47.2
⋮ ⋱ ⋮
47.3 48.4 49.5 50.6 51.7 60.5 61.6 62.7 63.8 64.9
51.6 52.8 54.0 55.2 56.4 66.0 67.2 68.4 69.6 70.8
55.9 57.2 58.5 59.8 61.1 … 71.5 72.8 74.1 75.4 76.7
60.2 61.6 63.0 64.4 65.8 77.0 78.4 79.8 81.2 82.6
64.5 66.0 67.5 69.0 70.5 82.5 84.0 85.5 87.0 88.5
68.8 70.4 72.0 73.6 75.2 88.0 89.6 91.2 92.8 94.4
73.1 74.8 76.5 78.2 79.9 93.5 95.2 96.9 98.6 100.3
77.4 79.2 81.0 82.8 84.6 … 99.0 100.8 102.6 104.4 106.2
81.7 83.6 85.5 87.4 89.3 104.5 106.4 108.3 110.2 112.1ggrd.lat37×17 Matrix{Float64}:
-35.0 -30.0 -25.0 -20.0 -15.0 … 20.0 25.0 30.0 35.0 40.0 45.0
-35.0 -30.0 -25.0 -20.0 -15.0 20.0 25.0 30.0 35.0 40.0 45.0
-35.0 -30.0 -25.0 -20.0 -15.0 20.0 25.0 30.0 35.0 40.0 45.0
-35.0 -30.0 -25.0 -20.0 -15.0 20.0 25.0 30.0 35.0 40.0 45.0
-35.0 -30.0 -25.0 -20.0 -15.0 20.0 25.0 30.0 35.0 40.0 45.0
⋮ ⋱ ⋮
-35.0 -30.0 -25.0 -20.0 -15.0 20.0 25.0 30.0 35.0 40.0 45.0
-35.0 -30.0 -25.0 -20.0 -15.0 20.0 25.0 30.0 35.0 40.0 45.0
-35.0 -30.0 -25.0 -20.0 -15.0 … 20.0 25.0 30.0 35.0 40.0 45.0
-35.0 -30.0 -25.0 -20.0 -15.0 20.0 25.0 30.0 35.0 40.0 45.0
-35.0 -30.0 -25.0 -20.0 -15.0 20.0 25.0 30.0 35.0 40.0 45.0
-35.0 -30.0 -25.0 -20.0 -15.0 20.0 25.0 30.0 35.0 40.0 45.0
-35.0 -30.0 -25.0 -20.0 -15.0 20.0 25.0 30.0 35.0 40.0 45.0
-35.0 -30.0 -25.0 -20.0 -15.0 … 20.0 25.0 30.0 35.0 40.0 45.0
-35.0 -30.0 -25.0 -20.0 -15.0 20.0 25.0 30.0 35.0 40.0 45.0An example of using Generalized Grids
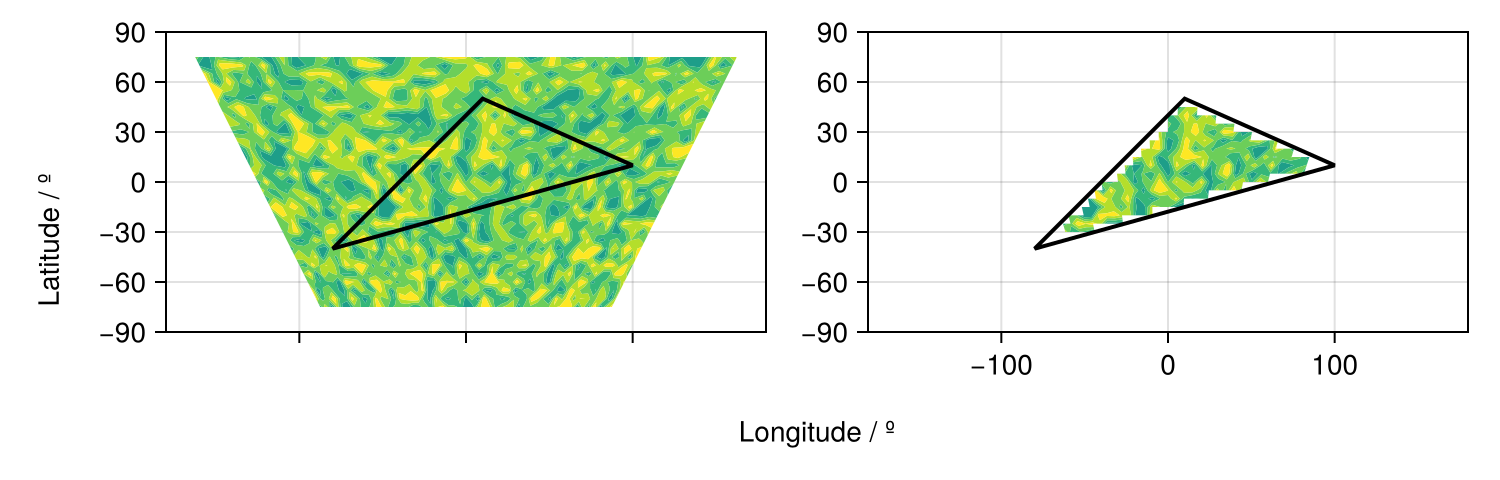
Say we have some sample data, here randomly generated.
data = rand(nlon,nlat)51×31 Matrix{Float64}:
0.185773 0.852503 0.925904 … 0.905842 0.13722 0.536303
0.787947 0.264976 0.0336965 0.297471 0.0860391 0.0860729
0.0754019 0.534554 0.49972 0.670453 0.923588 0.443784
0.675361 0.988218 0.491427 0.282921 0.985003 0.199285
0.089199 0.370875 0.269431 0.430403 0.862896 0.111194
0.0884432 0.246759 0.088502 … 0.253156 0.190056 0.627491
0.532996 0.89341 0.523698 0.575035 0.966299 0.205185
0.381852 0.561774 0.0839244 0.102622 0.0720986 0.174205
0.317472 0.041417 0.747815 0.576023 0.598071 0.726174
0.503907 0.326979 0.484766 0.572224 0.0232033 0.1435
⋮ ⋱ ⋮
0.882901 0.909442 0.926389 0.609939 0.594936 0.990426
0.913201 0.496848 0.731633 0.866135 0.494107 0.800621
0.184078 0.813995 0.431884 0.870042 0.201195 0.0536753
0.703325 0.797731 0.47846 … 0.36562 0.683018 0.142461
0.307732 0.503644 0.173882 0.94006 0.122907 0.126076
0.999899 0.637598 0.754651 0.434288 0.120662 0.0293012
0.0111406 0.724966 0.475774 0.407764 0.975514 0.833601
0.629332 0.00886338 0.195666 0.850544 0.0428714 0.465073
0.875512 0.691905 0.636923 … 0.49337 0.397933 0.828872We extract the valid data within the GeoRegion of interest that we defined above:
ndata = extract(data,ggrd)37×17 Matrix{Float64}:
0.0387828 NaN NaN … NaN NaN NaN NaN NaN
0.568937 NaN NaN NaN NaN NaN NaN NaN
0.90267 0.368901 NaN NaN NaN NaN NaN NaN
NaN 0.75999 0.272345 NaN NaN NaN NaN NaN
NaN 0.179572 0.49491 NaN NaN NaN NaN NaN
NaN 0.379686 0.958549 … NaN NaN NaN NaN NaN
NaN 0.328412 0.806097 NaN NaN NaN NaN NaN
NaN 0.126167 0.923421 NaN NaN NaN NaN NaN
NaN NaN 0.702015 NaN NaN NaN NaN NaN
NaN NaN 0.0777365 NaN NaN NaN NaN NaN
⋮ ⋱ ⋮
NaN NaN NaN 0.366887 NaN NaN NaN NaN
NaN NaN NaN 0.724352 NaN NaN NaN NaN
NaN NaN NaN … NaN NaN NaN NaN NaN
NaN NaN NaN NaN NaN NaN NaN NaN
NaN NaN NaN NaN NaN NaN NaN NaN
NaN NaN NaN NaN NaN NaN NaN NaN
NaN NaN NaN NaN NaN NaN NaN NaN
NaN NaN NaN … NaN NaN NaN NaN NaN
NaN NaN NaN NaN NaN NaN NaN NaNAnd now let us visualize the results.
slon,slat = coordinates(geo) # extract the coordinates
fig = Figure()

ax1 = Axis(
    fig[1,1],width=300,height=150,
    limits=(-180,180,-90,90)
)
contourf!(ax1,lon,lat,data,levels=-1:0.2:1)
lines!(ax1,slon,slat,color=:black,linewidth=2)
lines!(ax1,slon.+360,slat,color=:black,linewidth=2,linestyle=:dash)

hidexdecorations!(ax1,ticks=false,grid=false)

ax2 = Axis(
    fig[1,2],width=300,height=150,
    limits=(-180,180,-90,90)
)
contourf!(ax2,ggrd.lon,ggrd.lat,ndata,levels=-1:0.2:1)
lines!(ax2,slon,slat,color=:black,linewidth=2)

Label(fig[2,:],"Longitude / º")
Label(fig[:,0],"Latitude / º",rotation=pi/2)

resize_to_layout!(fig)
fig